 Vitreous
by Mansus
Vitreous
by Mansus
Vitreous
by Mansus
Vitreous
by Mansus
Western blot densitometry
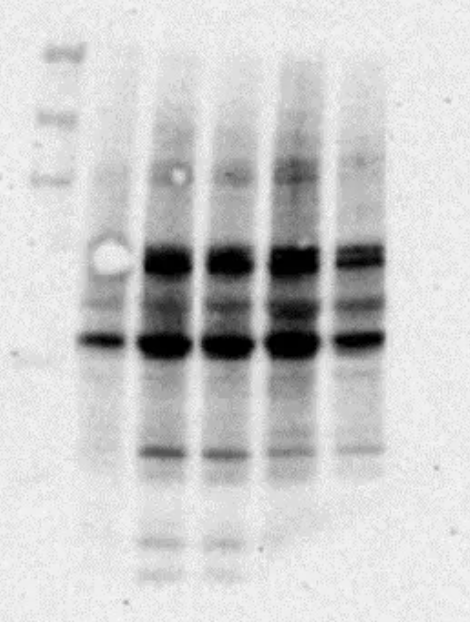
Vitreous detects protein bands with a fine-tuned YOLO model and computes background-corrected, lane-normalized intensity in seconds — no manual box-drawing, no spreadsheet gymnastics.
What it does
ML-powered detection of protein bands using a fine-tuned YOLO model — no manual selection.
Detected bands are automatically organized into logical rows for multi-lane comparisons.
Integrated density, edge-based background correction, and lane-to-lane relative intensity.
Real-time intensity profiles with adjustable detection thresholds, right on the image.
A built-in collection of western blot images to try the tool before uploading your own.
Export band measurements in one click for downstream statistical analysis.
Methodology
YOLO-based object detection identifies protein bands in the blot image.
Bands are clustered into rows based on Y-coordinate proximity.
Intensity is computed per band with edge-based background correction.
Relative intensities are normalized to each row's maximum for comparison.
No account, no setup. Drop in an image or try a sample from the gallery.
Launch App